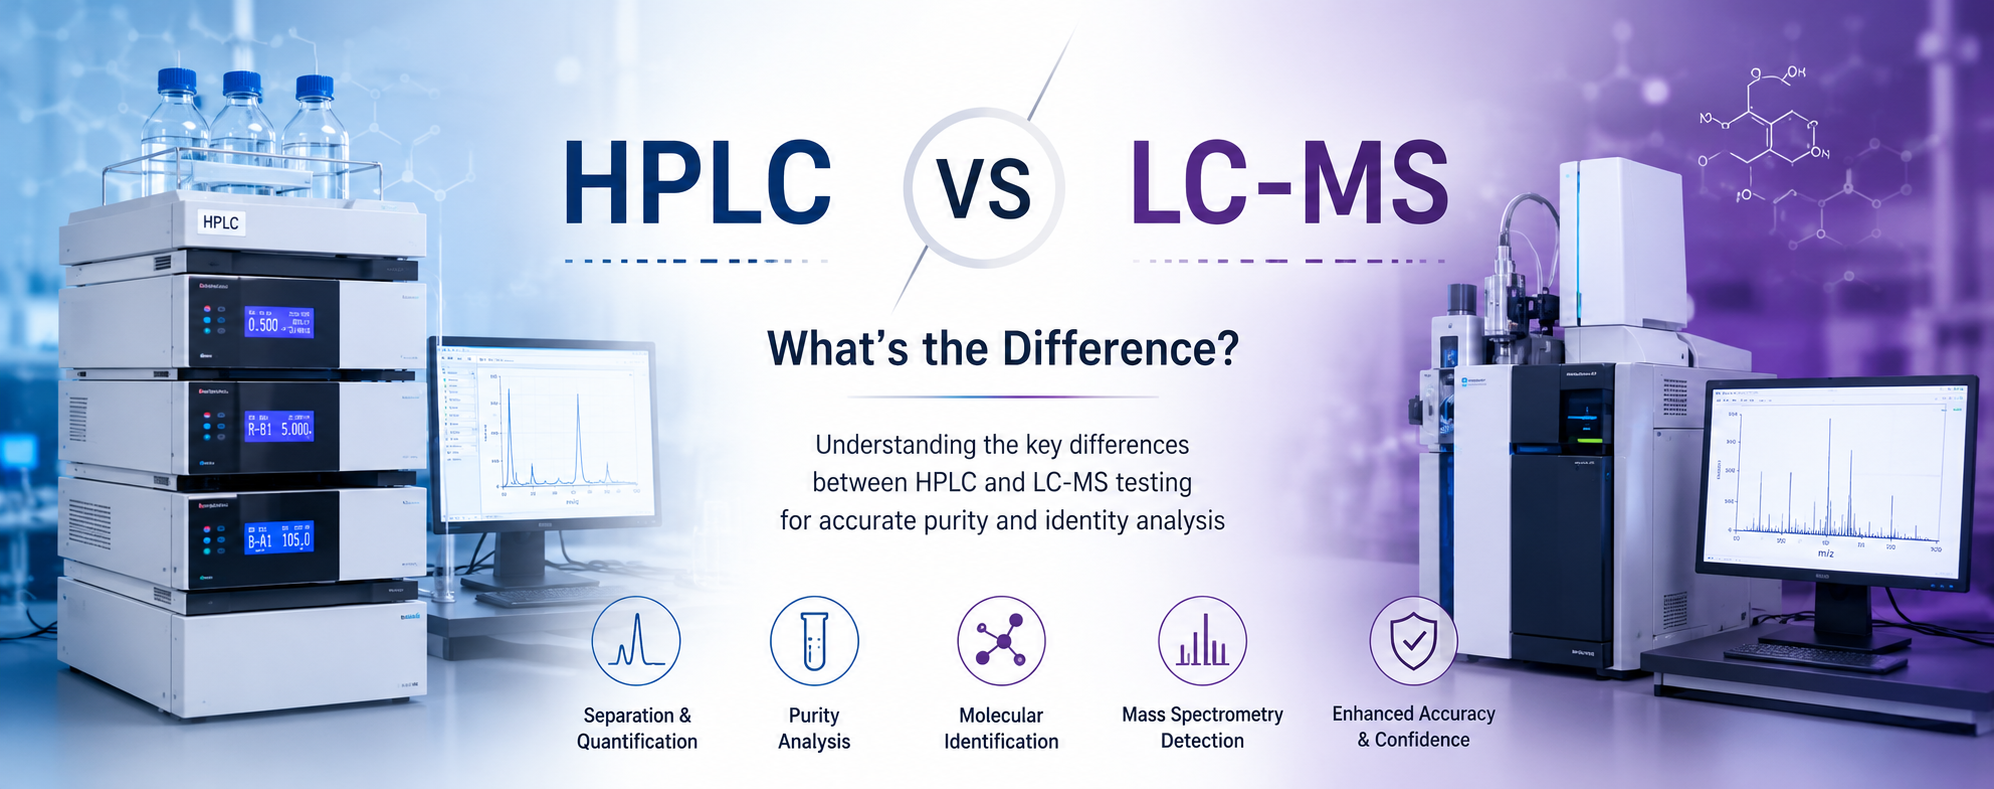
Analytical testing plays an important role in chemistry, biotechnology, pharmaceutical research and laboratory quality control. Before a compound is used in an experiment, researchers may need to confirm its identity, evaluate its purity and investigate any impurities that could influence the results.Two commonly used analytical techniques are High-Performance Liquid Chromatography (HPLC) and Liquid Chromatography–Mass Spectrometry (LC-MS). Although these techniques are often mentioned together, they provide different types of analytical information.
In many laboratory workflows, HPLC and LC-MS are complementary rather than competing methods. This guide explains how each technique works, their main differences, their advantages and limitations, and why laboratories may use both methods when analysing a sample.
What Is HPLC?
High-Performance Liquid Chromatography, commonly abbreviated as HPLC, is an analytical technique used to separate,
detect and quantify components within a liquid sample.
During HPLC analysis, a dissolved sample is introduced into a flowing liquid known as the mobile phase. The mobile phase carries the sample through a column packed with small particles known as the stationary phase.
Compounds interact with the stationary phase in different ways. Some components move through the column quickly, while others are retained for longer periods. This difference allows the substances within the sample to separate before reaching the detector.
Common HPLC detectors include:
- Ultraviolet detectors
- Photodiode array detectors
- Fluorescence detectors
- Refractive index detectors
The result of an HPLC analysis is normally displayed as a chromatogram. Each peak on the chromatogram represents a detected component under the conditions used in the analytical method.
How Does HPLC Work?
A typical HPLC system contains the following components:
- Solvent reservoirs: These contain the mobile phase used to transport the sample.
- Pump: The pump moves the mobile phase through the system at a controlled flow rate and pressure.
- Injector: The injector introduces a measured amount of sample into the mobile phase.
- Chromatographic column: The column separates the components of the sample.
- Detector: The detector records components as they leave the column.
- Data software: The software creates the chromatogram and helps the analyst review retention times and peak areas.
Each detected compound has a retention time. This is the period between injection and detection under a defined set of
analytical conditions.
Retention time can support comparison with a reference standard, but it should not normally be treated as complete proof of molecular identity on its own.
What Is LC-MS?
Liquid Chromatography–Mass Spectrometry, abbreviated as LC-MS, combines liquid chromatography with mass spectrometry.
The liquid chromatography stage separates the components of the sample. The separated compounds then enter a mass spectrometer, which detects ions according to their mass-to-charge ratio, commonly written as m/z.
This combination enables LC-MS to provide both chromatographic separation and molecular information. It is therefore widely used when researchers need stronger support for compound identification or need to investigate trace-level components within a complex sample.
How Does LC-MS Work?
LC-MS analysis generally involves four main stages.
1. Liquid Chromatography
The sample passes through a liquid chromatography column. Components areseparated according to their interactions with the mobile and stationary phases.
2. Ionisation
After leaving the column, the separated compounds enter an ion source. The molecules are converted into charged particles known as ions.
Common ionisation techniques include:
- Electrospray ionisation
- Atmospheric pressure chemical ionisation
3. Mass Analysis
The generated ions enter a mass analyser, which separates them according to their mass-to-charge ratios.
4. Detection and Data Processing
The detector records the abundance of different ions. The instrument software then produces a mass spectrum and associated chromatographic data.
LC-MS data may provide information about:
- Expected molecular mass
- Mass-to-charge ratios
- Isotopic patterns
- Fragmentation behaviour
- Relative ion abundance
- Possible degradation products
Key Differences Between HPLC and LC-MS
| Feature | HPLC | LC-MS |
|---|---|---|
| Primary purpose | Separation and quantification | Separation and molecular identification |
| Typical detector | UV, PDA, fluorescence or refractive index | Mass spectrometer |
| Molecular mass information | Generally not provided directly | Yes |
| Compound identification | Usually based on retention time and standards | Supported by mass-to-charge data |
| Sensitivity | High for many routine applications | Often very high |
| Unknown compound analysis | Limited without additional testing | More suitable for investigation |
| Instrument complexity | Moderate | High |
| Operating cost | Generally lower | Generally higher |
| Data interpretation | Relatively straightforward for validated methods | Often requires specialist expertise |
What Information Does HPLC Provide?
HPLC is especially useful for separating components in a sample and measuring detector responses associated with those components.
Laboratories commonly use HPLC for:
- Assessing chromatographic purity
- Quantifying a known compound
- Detecting visible impurities
- Comparing batch consistency
- Monitoring chemical reactions
- Studying degradation over time
- Performing routine quality-control analysis
In purity testing, laboratories may calculate the percentage of the total detected peak area represented by the main peak. This is sometimes described as area-percent purity.
However, a high chromatographic purity result does not automatically confirm molecular identity, quantity, sterility or the absence of every possible contaminant. The result must be interpreted according to the detector, analytical method and sample preparation used.
What Information Does LC-MS Provide?
LC-MS adds mass spectrometric information to chromatographic separation. This makes it particularly useful when identity confirmation or trace analysis is required.
LC-MS may be used to:
- Support confirmation of molecular identity
- Determine molecular mass
- Detect low-level components
- Investigate unknown chromatographic peaks
- Characterise degradation products
- Analyse complex biological samples
- Study metabolites
- Review fragmentation patterns
Depending on the instrument and method, LC-MS may distinguish compounds that produce similar retention times or weak responses under conventional optical detection.
Why Are HPLC and LC-MS Often Used Together?
HPLC and LC-MS answer different analytical questions. For that reason, laboratories may use both techniques as part of a broader testing strategy.
For example:
- HPLC may show that one major peak accounts for most of the detected
chromatographic area. - LC-MS may help determine whether that peak is associated with the
expected molecular species. - HPLC may reveal additional minor peaks.
- LC-MS may provide molecular information that supports investigation of
those minor components.
In simple terms, HPLC can help answer “How many detectable components are present, and in what relative amounts?”
LC-MS can help answer “What molecular species may be associated with those components?”
Neither result should be interpreted beyond the scope of the analytical method used.
Understanding an HPLC Chromatogram
An HPLC chromatogram is a graph showing detector response over time. The horizontal axis normally represents retention time, while the vertical axis represents the detector signal.
Retention Time
Retention time indicates when a component reaches the detector after the sample is injected.
Peak Height
Peak height represents the maximum detector response associated with a chromatographic peak.
Peak Area
Peak area is the integrated detector response across the full peak. It is often used for relative or quantitative calculations when supported by an appropriate analytical method.
Peak Shape
Well-resolved and reasonably symmetrical peaks generally indicate good chromatographic performance. Tailing, fronting, splitting or broadening may indicate method, column or sample-related issues.
Baseline Separation
Baseline separation occurs when adjacent compounds are sufficiently separated for their peaks to be evaluated independently.
Understanding a Mass Spectrum
A mass spectrum displays detected ions according to their mass-to-charge ratio. The horizontal axis represents m/z, while the vertical axis shows relative ion abundance or signal intensity.
Analysts may examine:
- Molecular ion or protonated molecular ion peaks
- Multiply charged ions
- Fragment ions
- Isotopic distributions
- Relative signal intensity
- Adduct formation
Large molecules may produce several charge states rather than a single peak corresponding directly to their molecular mass. Specialist software can sometimes deconvolute these signals to estimate the neutral molecular mass.
Advantages and Limitations of HPLC
Advantages of HPLC
- Well-established analytical technique
- Suitable for routine laboratory testing
- Useful for separation and quantification
- Good reproducibility with validated methods
- Applicable to a broad range of compounds
- Generally less complex than LC-MS
- Often more economical for routine analysis
Limitations of HPLC
- Does not normally provide molecular mass directly
- Retention time alone may not prove identity
- Co-eluting compounds may affect interpretation
- Detector response varies between substances
- Unknown peaks may require additional analytical investigation
- Some compounds may have weak UV absorbance
Advantages and Limitations of LC-MS
Advantages of LC-MS
- Provides molecular mass information
- Offers high sensitivity and selectivity
- Can detect trace-level compounds
- Supports investigation of unknown substances
- Useful for complex mixtures
- Can provide fragmentation and structural information
- May distinguish compounds with similar chromatographic behaviour
Limitations of LC-MS
- Higher equipment and maintenance costs
- Requires trained operators
- Produces more complex datasets
- Ion suppression may affect signal intensity
- Not every compound ionises efficiently
- Method development may be more demanding
- Results depend on instrument type and acquisition settings
Does HPLC Purity Confirm Compound Identity?
Not by itself. HPLC purity and molecular identity are related but different analytical measurements.
A sample may show one dominant HPLC peak, but that peak still needs to be associated with the expected compound through appropriate reference materials, method comparison or a complementary identity test.
LC-MS can provide stronger evidence by comparing the measured molecular mass or mass-to-charge pattern with the expected value. However, LC-MS results must also be interpreted carefully and within the limitations of the method.
Can LC-MS Measure Purity?
LC-MS can detect and compare components within a sample, but mass spectrometric signal intensity does not always correspond directly to the quantity of each compound.
Different substances can ionise with very different efficiencies. A small amount of one impurity may produce a strong signal, while a larger amount of another substance may produce a weak signal.
For this reason, LC-MS peak intensity should not automatically be treated as an exact purity percentage unless the method has been appropriately validated for quantitative analysis.
What Should an Analytical Report Include?
A useful laboratory report or Certificate of Analysis should provide enough information to understand what was tested and how the result was produced.
Relevant information may include:
- Sample or batch identification
- Date of analysis
- Analytical technique used
- Method reference or conditions
- Column and detector details
- Retention time information
- Chromatogram or mass spectrum
- Reported purity or identity result
- Expected and observed molecular mass
- Laboratory identification
- Reviewer or analyst approval
Results should always be evaluated in context. A report that only states a percentage without supporting method information may provide less analytical transparency than a report containing chromatographic and mass-spectrometric evidence.
Choosing the Appropriate Analytical Technique
The most appropriate technique depends on the analytical question being investigated.
HPLC May Be Appropriate When the Objective Is To:
- Assess chromatographic purity
- Quantify a known compound
- Monitor batch consistency
- Measure degradation over time
- Perform routine quality-control testing
LC-MS May Be Appropriate When the Objective Is To:
- Support confirmation of molecular identity
- Determine molecular mass
- Investigate unknown peaks
- Detect trace components
- Analyse complex mixtures
- Characterise degradation products
For comprehensive sample characterisation, laboratories may combine HPLC, LC-MS and other analytical techniques. Additional testing may include nuclear magnetic resonance spectroscopy, amino acid analysis, water determination, residual solvent testing, microbial testing or elemental analysis, depending on the compound and intended research objective.
HPLC vs LC-MS: Which Is Better?
Neither technique is universally better. Each method addresses a different part of the analytical process.
HPLC is highly effective for routine separation, purity assessment and quantitative testing. LC-MS offers additional specificity by providing molecular mass and ion information.
The strongest analytical strategy is often to select the method, or combination of methods, that directly answers the research question.
Conclusion
HPLC and LC-MS are two important analytical techniques used in chemistry, biotechnology and laboratory quality control.
HPLC separates compounds and measures their detector responses, making it especially useful for chromatographic purity assessment, quantification and routine batch comparison.
LC-MS combines chromatographic separation with mass spectrometry, providing molecular mass information and stronger support for compound identification.
Because the techniques provide different types of data, laboratories frequently use them together. HPLC may help demonstrate how well a sample
is separated, while LC-MS may help confirm whether the detected component corresponds to the expected molecular species.
Accurate interpretation requires suitable analytical methods, calibrated equipment, qualified personnel and transparent reporting of the test conditions.
Frequently Asked Questions
1. What does HPLC stand for?
HPLC stands for High-Performance Liquid Chromatography. It is used to separate, detect and quantify components in a liquid sample.
2. What does LC-MS stand for?
LC-MS stands for Liquid Chromatography–Mass Spectrometry. It combines chromatographic separation with mass-based detection.
3. Is LC-MS more sensitive than HPLC?
LC-MS is often more sensitive for trace analysis, but sensitivity depends on the compound, detector, ionisation efficiency and analytical
method.
4. Can HPLC confirm molecular identity?
HPLC can support identification through retention-time comparison, but it does not normally provide molecular mass information. Complementary testing may therefore be required.
5. Can LC-MS determine purity?
LC-MS can detect multiple components, but signal intensity does not always equal concentration. Quantitative purity conclusions require an appropriately validated method.
6. Why are HPLC and LC-MS used together?
HPLC provides separation and relative quantification data, while LC-MS adds molecular mass and identification information.
7. What is an HPLC chromatogram?
An HPLC chromatogram is a graph showing detector response against retention time. Peaks represent components detected during the
analysis.
8. What does m/z mean in LC-MS?
The abbreviation m/z means mass-to-charge ratio. The mass spectrometer separates and detects ions according to this value.
9. Does a 99% HPLC result mean the material is 99% pure by weight?
Not necessarily. It may refer to the percentage of total detected chromatographic peak area. It does not automatically measure every
non-detectable component, water content or residual solvent.
10. Which test is better for confirming molecular mass?
LC-MS is generally the more appropriate technique because it measures ions according to their mass-to-charge ratios.
This article is provided for general scientific and educational information only. Analytical results should be interpreted by suitably trained laboratory professionals and within the scope and limitations of the analytical method used.